Projects & Case Studies
Real work across six SDG domains. Public health, agriculture, finance, education, environment, and governance. Each project reflects field experience or original analysis.
Predictive ML · Health operations
Healthcare Readmission Risk Prediction
Portfolio-grade predictive triage workflow showing feature engineering, model validation, risk bands, and deployment thinking for chronic care follow-up.
Data engineering · ETL
ETL Pipeline Architecture
Raw survey and facility extracts transformed into validated reporting layers with reproducible R workflows and QA rules.
AI application · Evidence translation
Research Brief Generator
LLM-assisted workflow for turning long-form health papers into structured implementation briefs with a consistent schema.
Business case study · Health financing
NCD Financing Impact Case Study
Reframes chronic care financing bottlenecks as an operations problem with scenario modeling and implementation levers.
Dashboard product · Monitoring
Health Financing Real-Time Dashboard
A synthetic Shiny dashboard concept for tracking reimbursement lag, stockout risk, and facility-level intervention priorities.
MSc Research · Kisumu County · Georgetown gui2de
Financial Determinants of NCD Management in Primary Health Facilities
Mixed methods study across 7 public primary care facilities in Seme Sub County examining how facility financing architecture shapes continuity of hypertension and diabetes care.
Manuscript data snapshot from 7 facilities
Maternal Health · SDG 3
Maternal Mortality Trends in Sub-Saharan Africa
Multi-country analysis of maternal mortality ratios using WHO data, with difference-in-differences modelling and publication-quality visualisations.
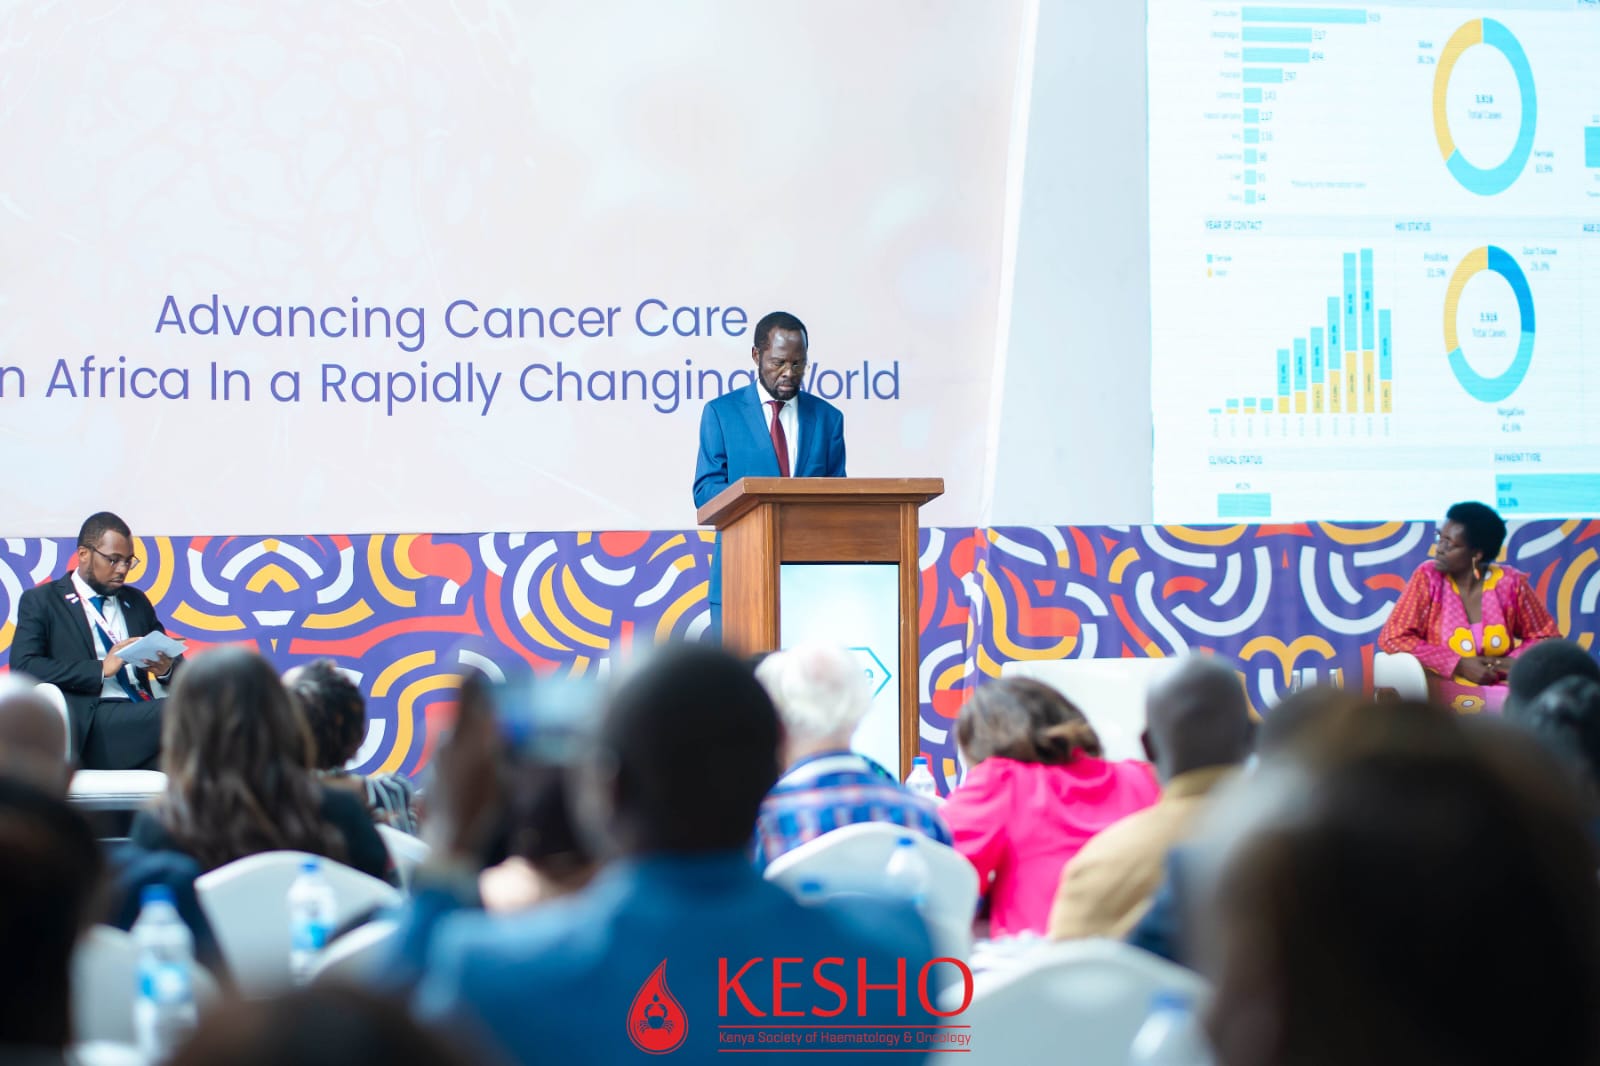
Oncology · KEMRI
Cancer Surveillance Dashboard in Kisumu
Epidemiological analysis of cancer incidence data from the KEMRI Oncology Registry, with interactive Power BI dashboard and trend analysis.
MEL Systems · USAID reporting context
MEL Framework for Multi Site Health Programmes
Designed indicator trees, data quality checks, and reporting schedules for complex health programmes. Supported alignment between field operations, donor metrics, and learning agendas.
Health Economics · Georgetown gui2de
Health Financing Impact Evaluation
Built panel data workflows and quasi experimental analyses for health financing and household expenditure studies. Integrated dashboards and quarterly evidence products for program decisions.
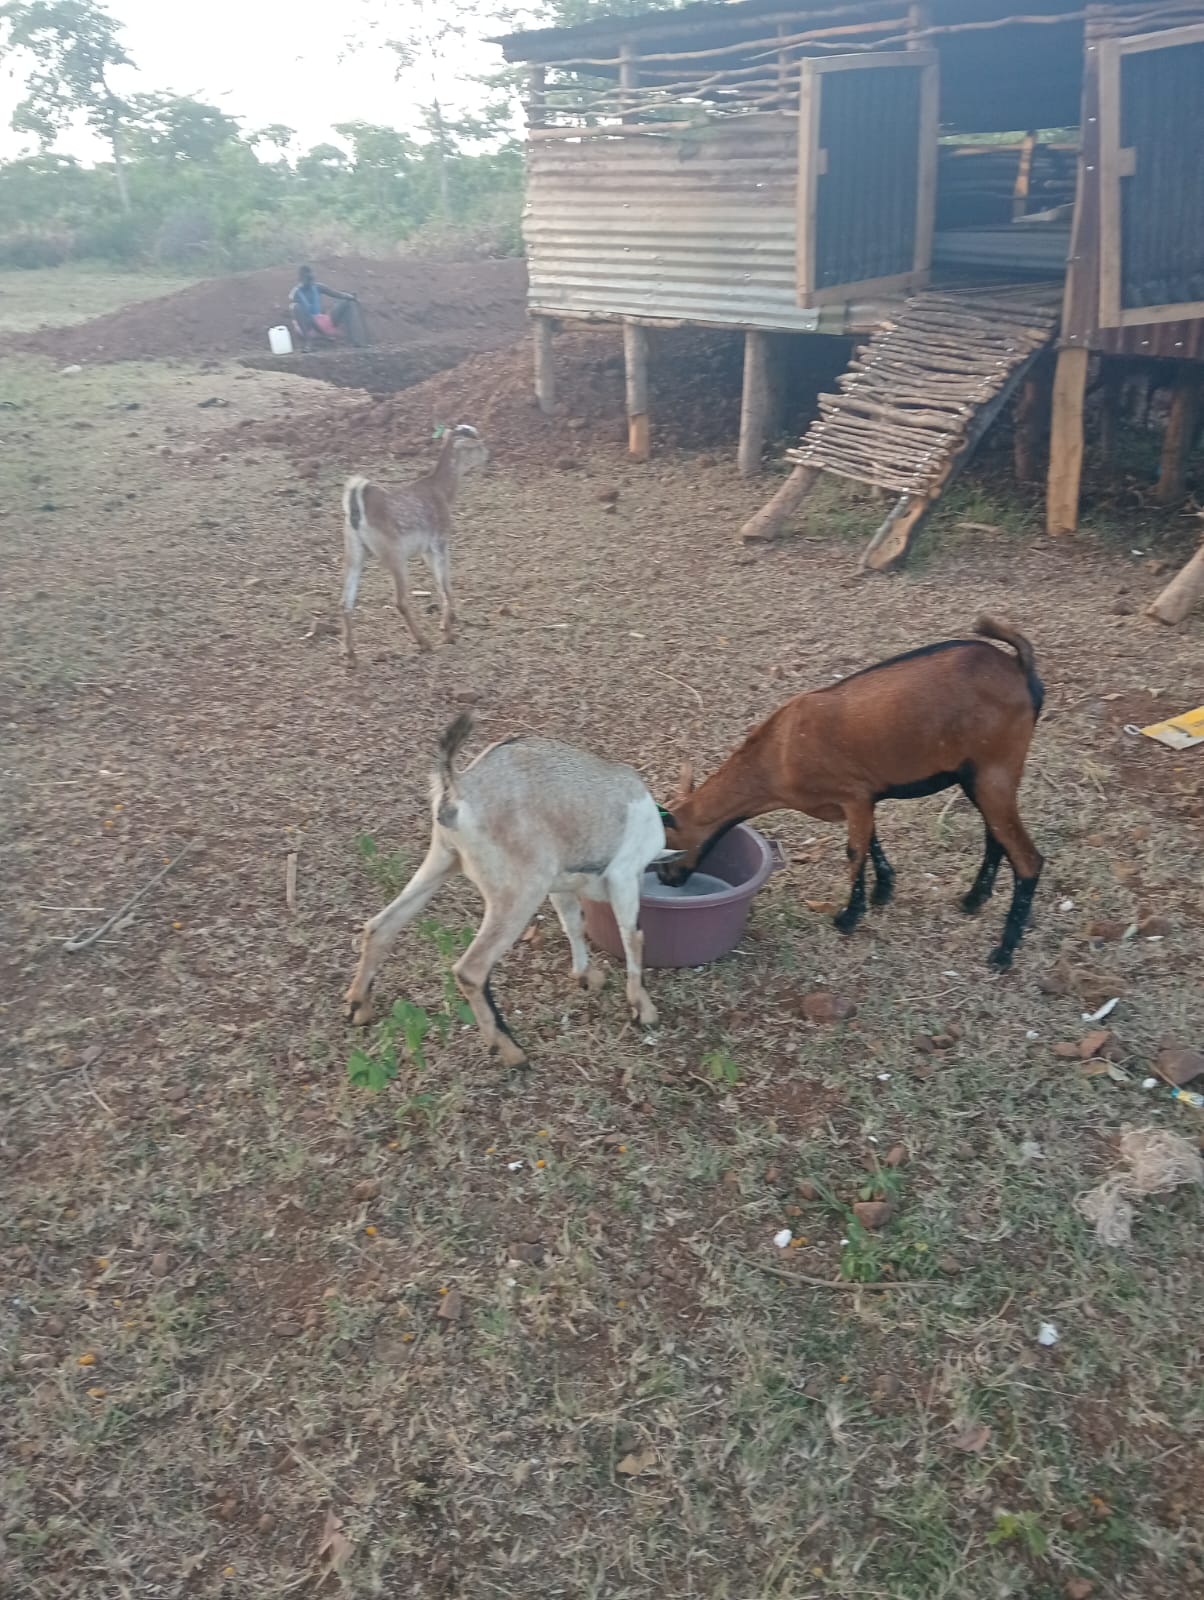
Agricultural Economics · Homa Bay County · SDG 2
Goat Farming Economics: Small-Ruminant Production Systems
Field-collected profitability analysis of small-ruminant production in Homa Bay. Combines cost data from smallholder farmers with market price modelling to produce practical decision tools for extension services.
Food Security · SDG 2
Food Security Analysis in East Africa
Regional food security trends using FAO and household survey data. Vulnerability mapping and seasonal analysis.
Agri logistics · Input systems
Agricultural Supply Chain Analytics
Mapped fertilizer and seed distribution workflows, modeled delivery delays, and designed monitoring views for stock movement and last mile access in rural counties.
Financial Inclusion · SDG 10
Mobile Money, Banking Access and Health Outcomes
Correlation analysis linking mobile money penetration, formal banking access, and health expenditure patterns across Sub-Saharan Africa using World Bank and GSMA datasets.
Real estate strategy · portfolio planning
Mixed Use Development Feasibility Studio
Case brief and decision studio built from public market indicators, listing level comparables, and developer cost assumptions. Covers SQL and R data pipeline, cleaning and harmonization, discounted cash flow analysis, scenario testing, and dashboard outputs for investment and ROI decisions.
Household finance · Longitudinal data
Financial Diaries Analytics
Built analysis pipelines for high frequency household diaries, with volatility indicators, coping strategy tracking, and policy focused summaries for social protection design.
Business analytics · development operations
Development Operations Case Brief
Shows end to end analytics delivery from data intake and cleaning to scenario modeling and executive dashboarding. Structured for finance, planning, engineering, and construction stakeholders aligning on cost control, phasing, and return outcomes.
Data engineering · Multi country RCT
Research Data Engineering Pipeline
Architected a reproducible pipeline for cleaning, harmonization, and dashboard outputs using SQL, R, and automated validation layers across multiple countries.
Health information systems · DHIS2
DHIS2 Integration and Reporting Automation
Designed a reporting workflow that joins DHIS2 extracts with field operations data for faster indicator reporting, exception monitoring, and partner dashboards.