Research & M&E
Designing studies, building logframes, and leading RCTs and quasi-experimental evaluations across Kenya, Uganda, and Tanzania.
ODK · KoboToolbox · REDCap · SPSS · Stata
Research Data Manager · AI Systems · Data Analyst · M&E
I help teams turn messy field data into decisions they can trust.
I work at the intersection of field research and data engineering. The work often starts with designing surveys in communities with no internet, then moves through the pipelines that clean and model what comes back. From there it becomes reports, dashboards, and decisions teams can actually use. I work best close to the people, programmes, and constraints the data is meant to serve.

Expertise
From research design to dashboard delivery, the work is built for teams operating in real places with real constraints.
Designing studies, building logframes, and leading RCTs and quasi-experimental evaluations across Kenya, Uganda, and Tanzania.
ODK · KoboToolbox · REDCap · SPSS · Stata
Turning messy survey exports into decisions through SQL pipelines, Power BI dashboards, and reproducible R and Python workflows.
SQL · Power BI · R · Python · Quarto
Owning the chain from literature review and tool design through training, HFC, cleaning, analysis, reporting, and stakeholder engagement.
XLSForm · DHIS2/KHIS · HFC · PostgreSQL · Git
Process
From the first community conversation to the final policy brief. Every step is structured to keep quality, speed, and trust intact.
ODK · KoboToolbox · REDCap · Lit Review
XLSForm · DHIS2 · CommCare
HFC · Supervision · QA Protocols
R · Python · Stata · SPSS
SQL · Regression · DiD · ML
Power BI · R Markdown · Quarto
Policy Briefs · Presentations
Selected Work
Work across public health, finance, urban analytics, and analytics engineering, from field studies to decision-ready systems.
Seven-facility mixed-methods work in Seme Sub-County showing how narrow funding streams, county approval delays, and missing NCD budget lines disrupt hypertension and diabetes care.
Read paper →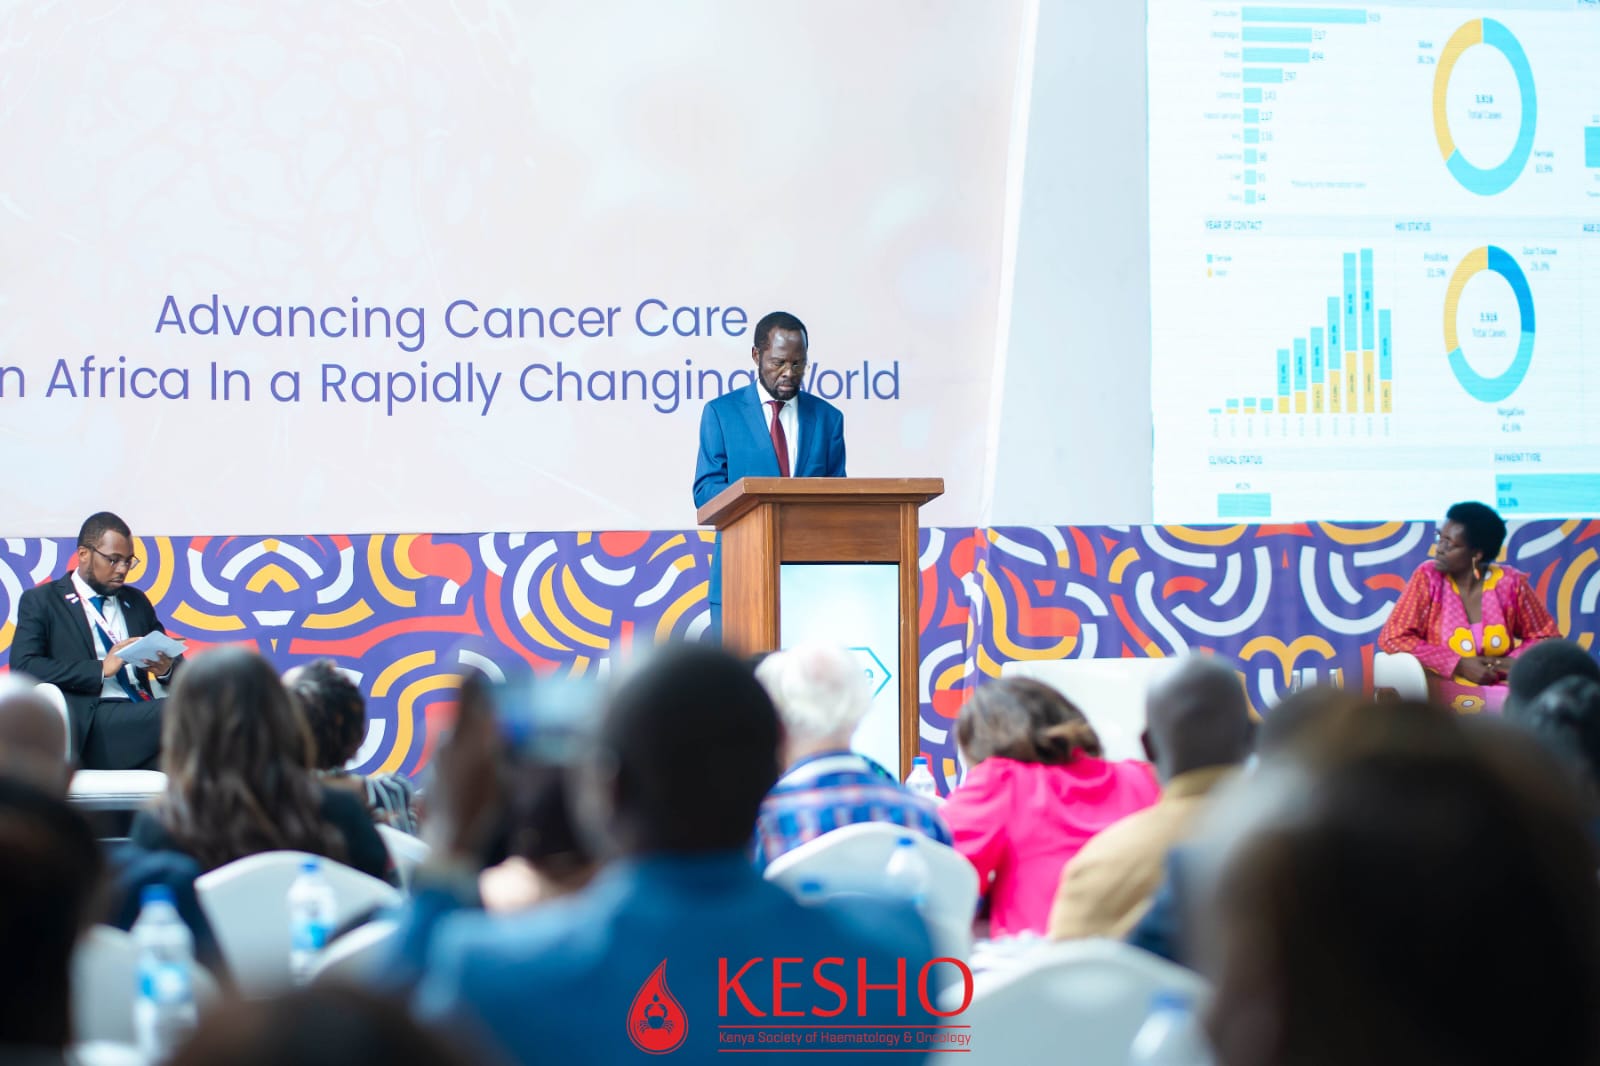
Portfolio work that connects data preparation, modelling logic, and decision support in a clinically legible way.
View →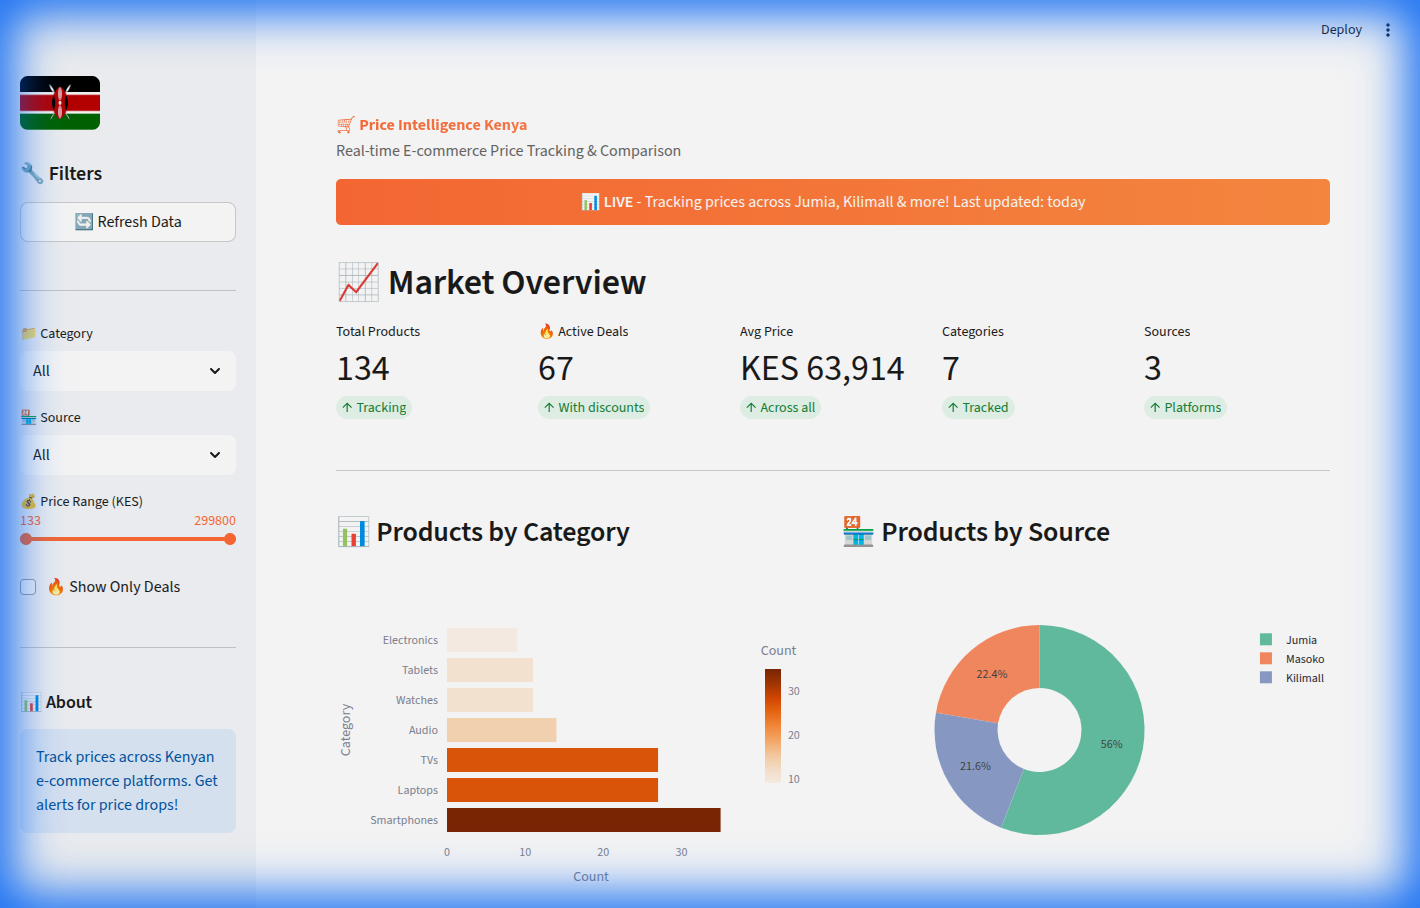
Logistics analytics architecture covering inventory flow, shipment reliability, and service-level monitoring for distributed operations.
Portfolio brief →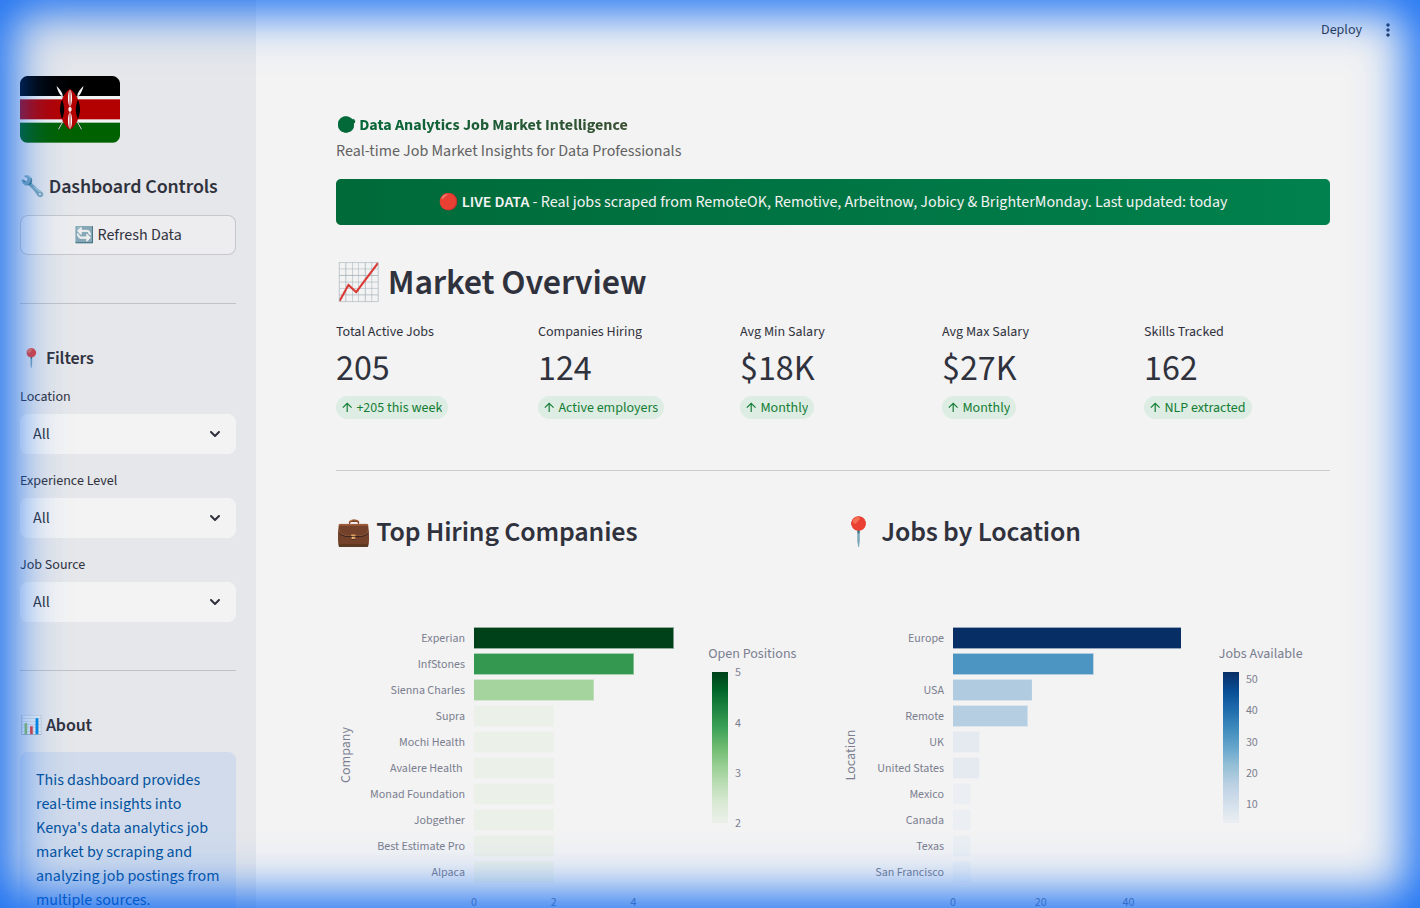
Neighbourhood-level exploration of rent and sales patterns using trend decomposition, geospatial segmentation, and valuation signals.
Portfolio brief →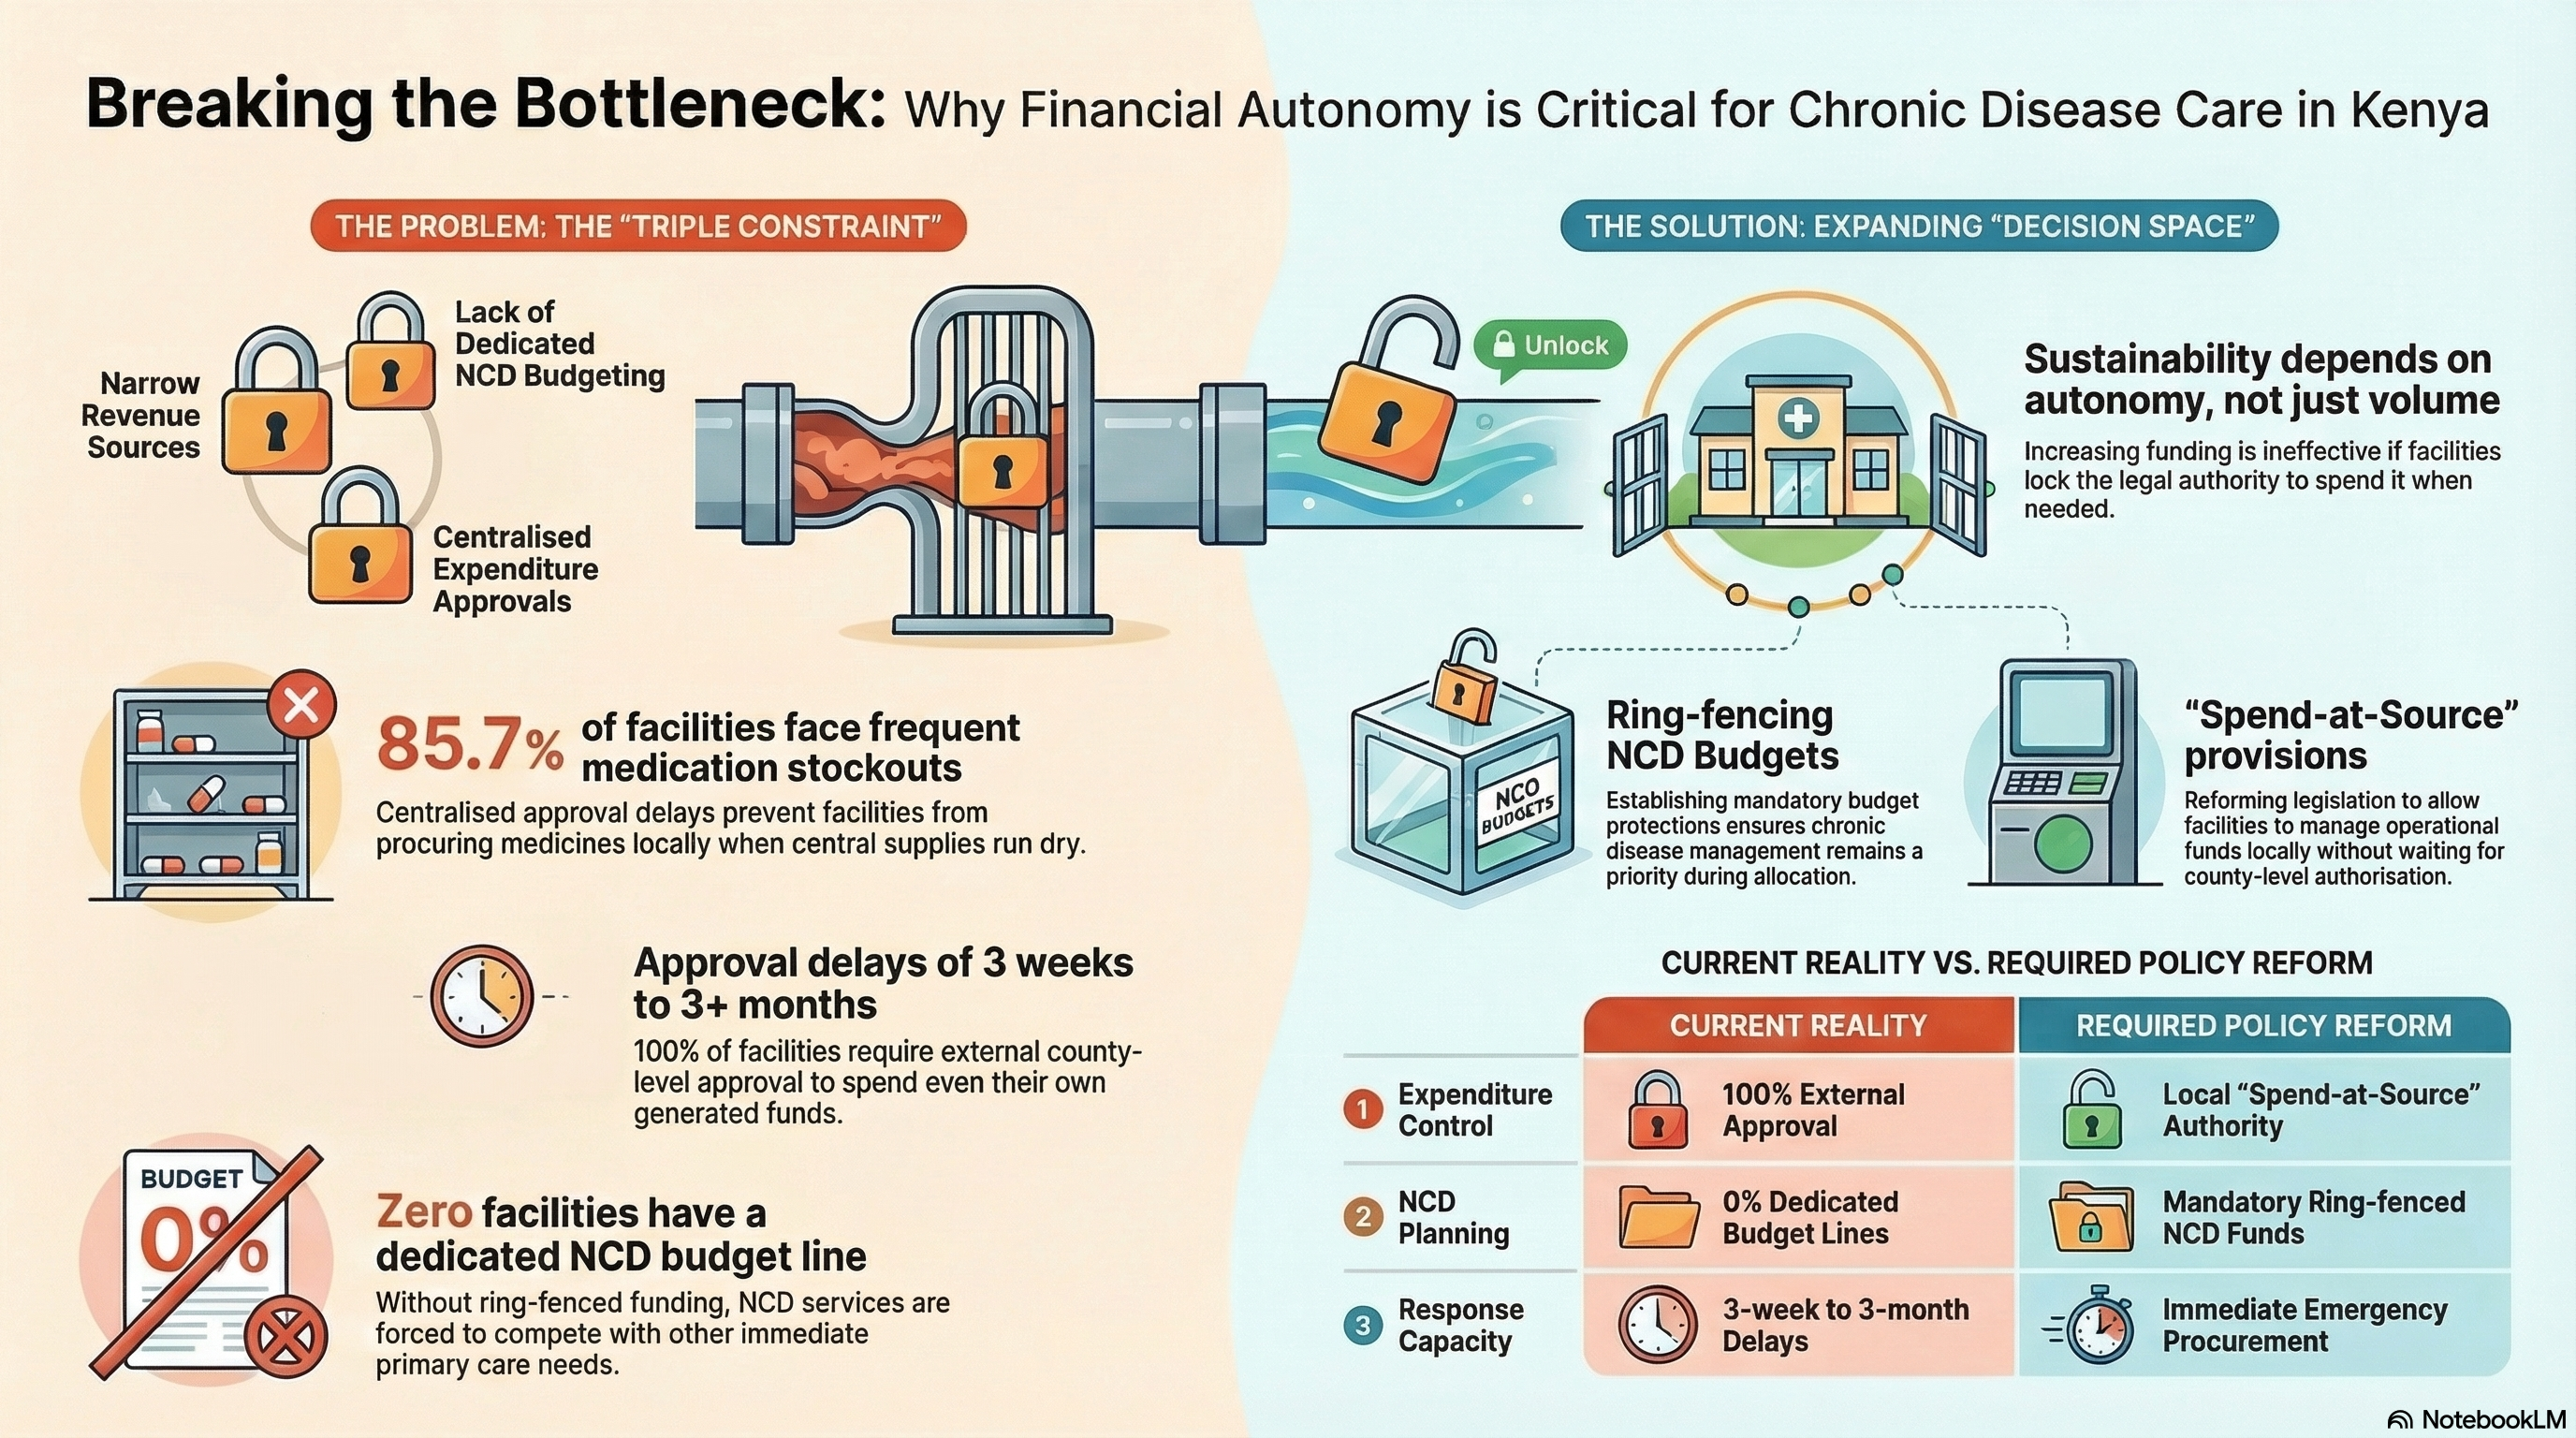
An AI-assisted workflow for turning structured inputs into concise, reusable summaries without losing research structure.
View →Technical Skills
Built through field work, not just coursework. Each tool here has solved a real delivery problem.
Background
A track record built through delivery, not just titles: research systems, public health analytics, cross-country fieldwork, and reporting that senior stakeholders can act on.
Georgetown University gui2de · Remote / Kenya
Leading data architecture for the Health Financial Diaries project across 1,000+ households, with automated dashboards for real-time policy metrics.
KEMRI · Nairobi and Kisumu
Built integrated health analytics pipelines and survival-analysis workflows for surveillance, decision support, and partner reporting.
JOOUST and VLIR UOS · Kenya, Uganda, Rwanda
Coordinated cross-country datasets, supported randomized and quasi-experimental analysis, and trained teams on quality and reproducibility.
LERIS Hub · Kenya and Uganda
Designed monitoring frameworks and data-collection workflows, then delivered policy and donor reporting products for complex programmes.
JOOUST · Kenya
Thesis focus on financial determinants of effective hypertension and diabetes care in rural primary facilities.
University of Nairobi · Kenya
Second Class Upper Division.
Life Beyond Data
A window into the life that informs the work: communities, land, teams, and the long view behind the numbers.
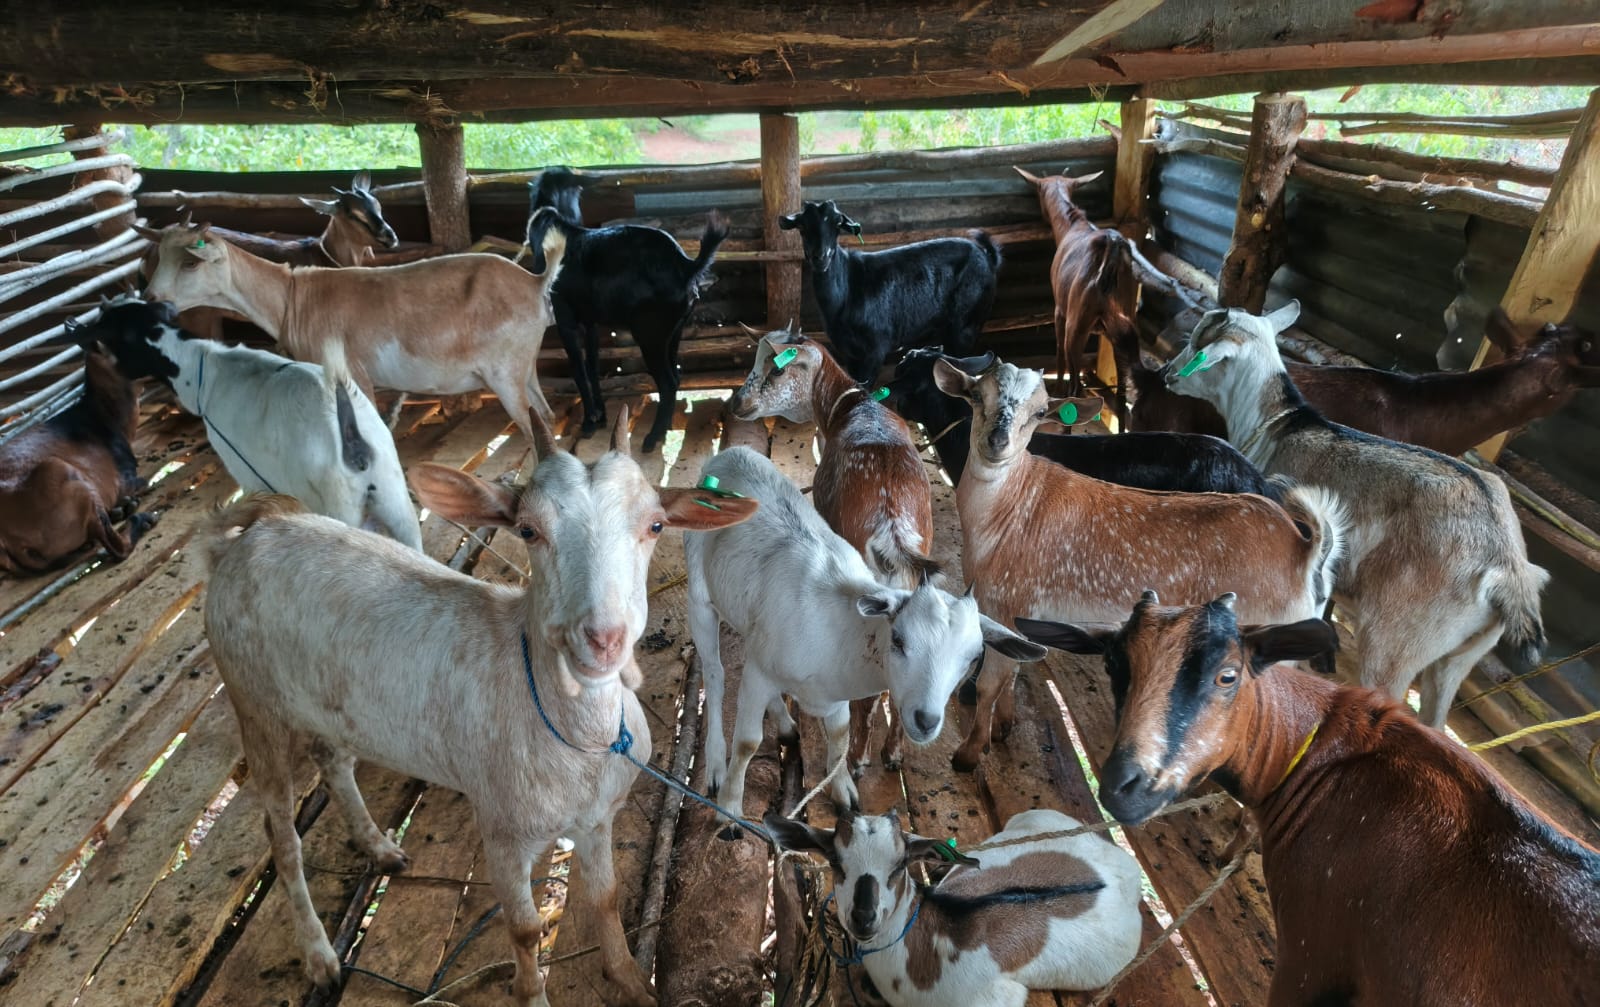 Goat Farming
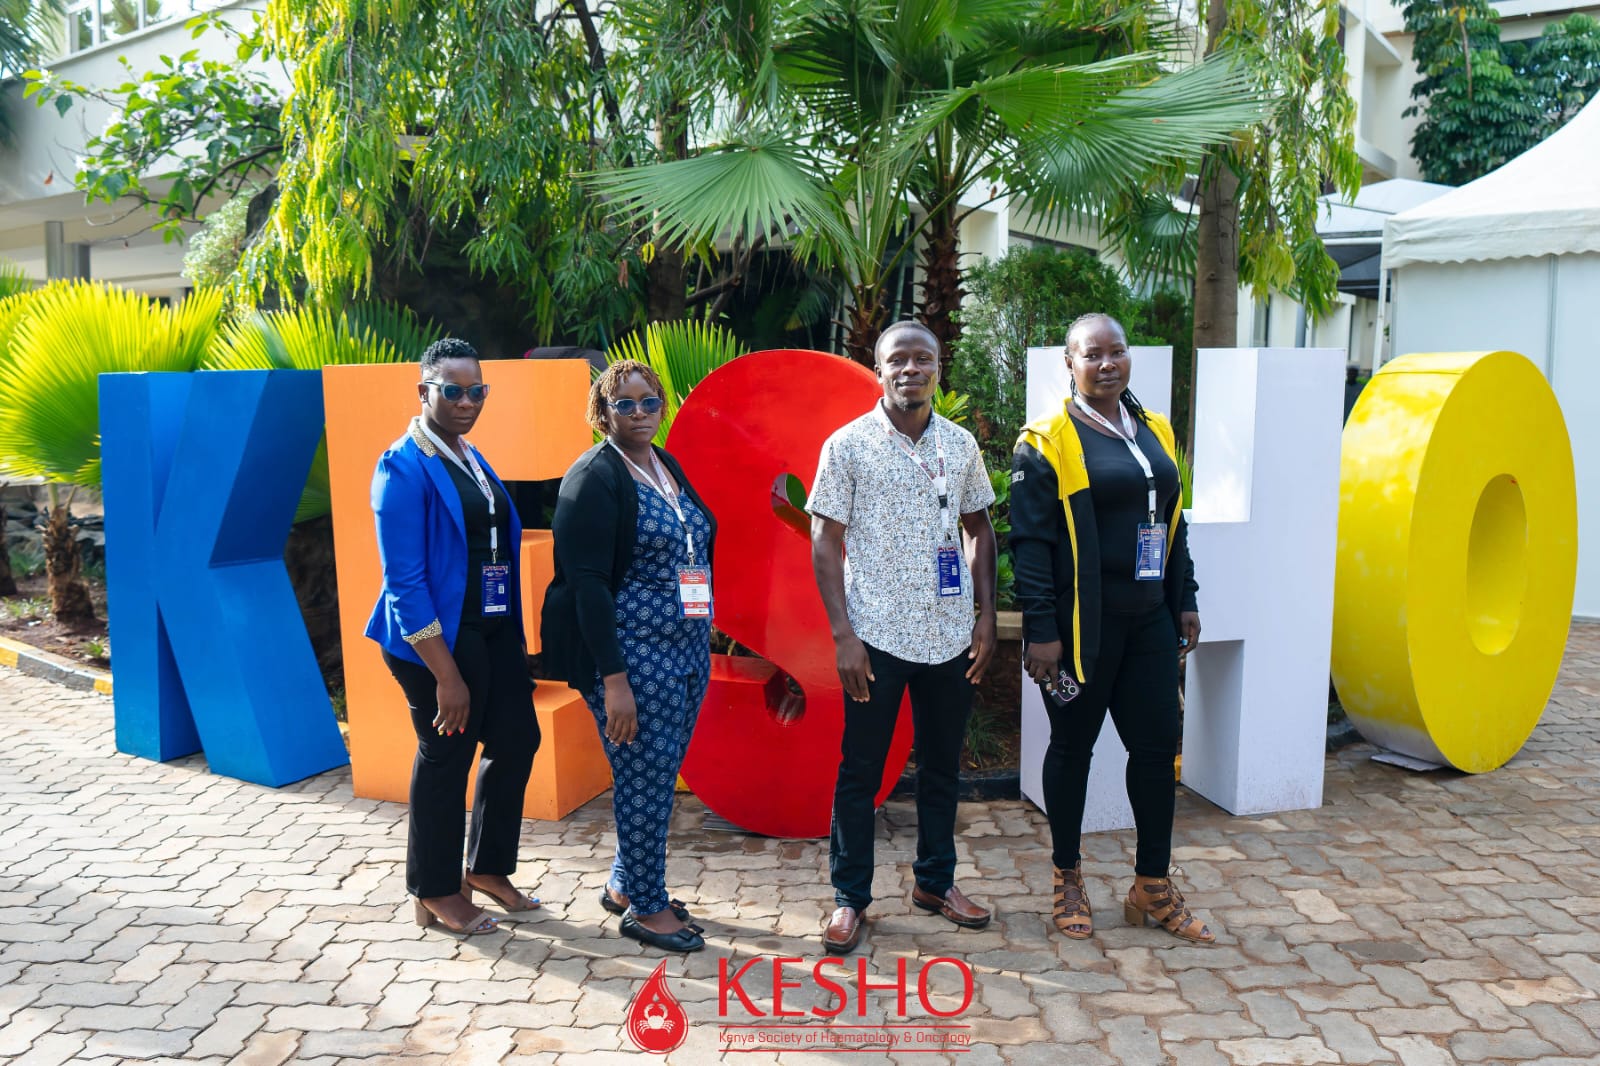 KESHO Conference
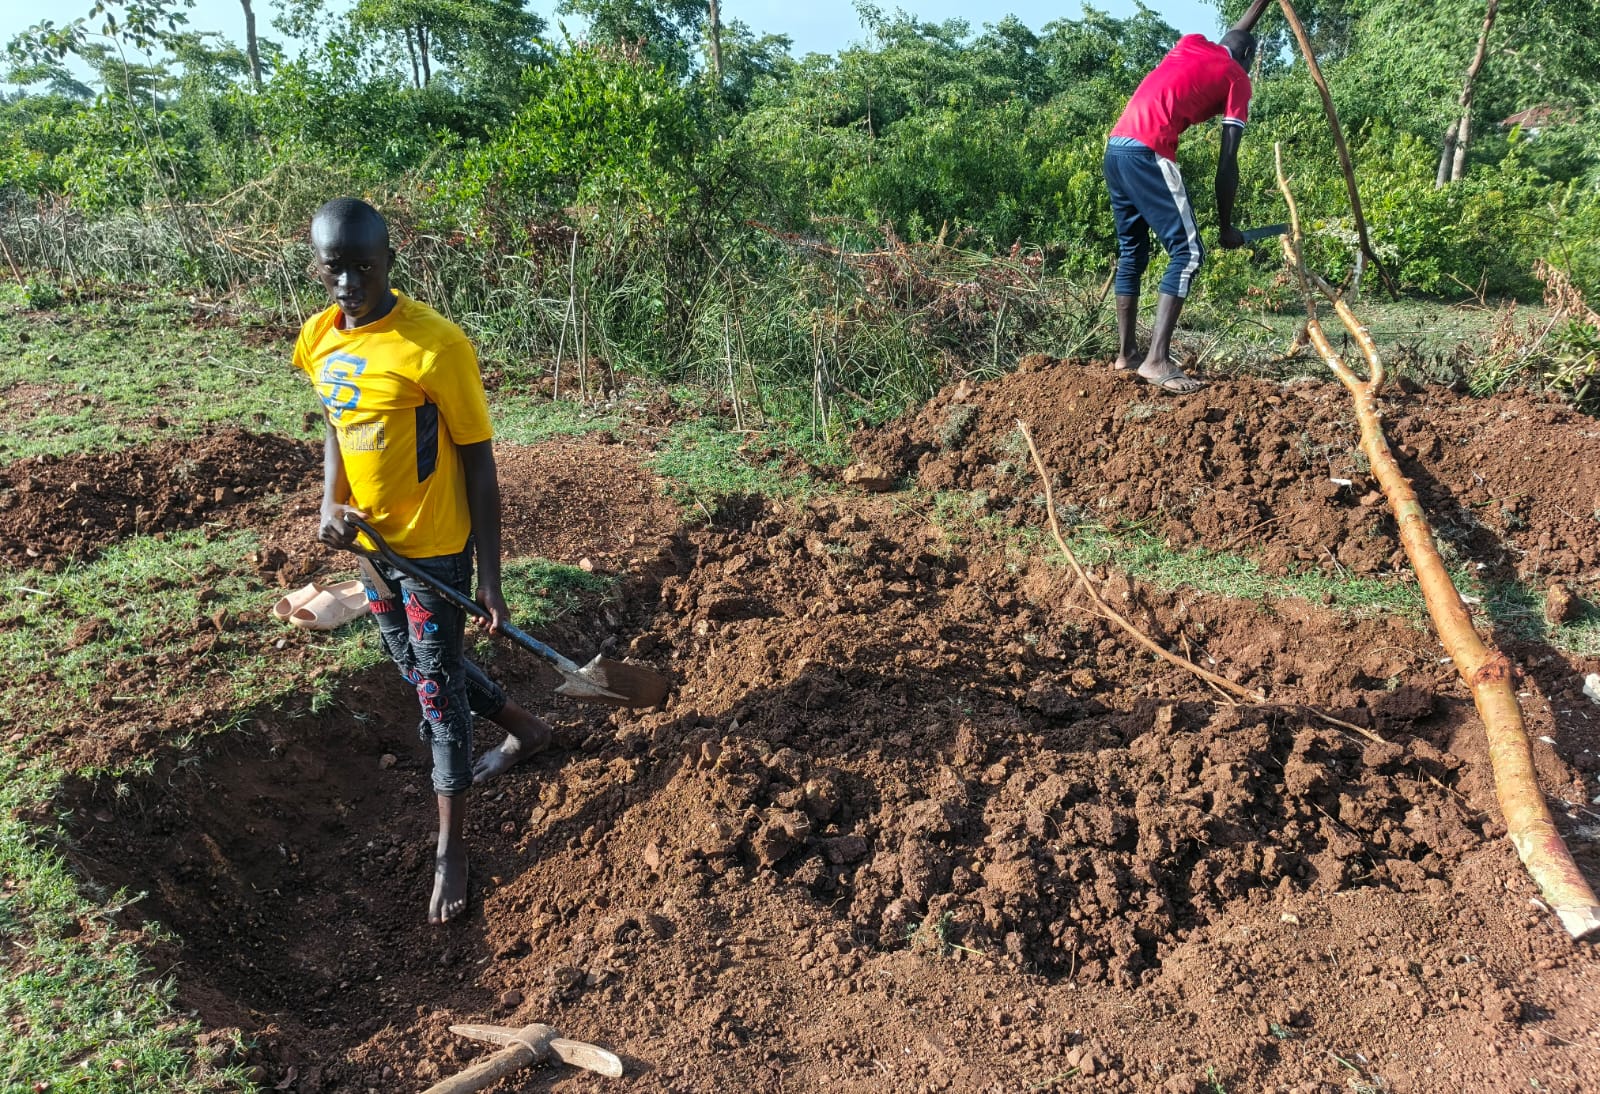 Community & Labour
Channel Open
Whether you need a research partner, an analyst embedded in your team, or someone to build the M&E system from scratch, I’d like to hear from you.
For teams building better health systems, stronger data infrastructure, and decision-ready evidence that can survive real-world operations.
Nairobi, Kenya. Open to remote and hybrid work, with replies usually within 48 hours.