Health Financial Diaries Systems
Field streaming, HFCs, and live ops apps for a year-long household study
Field delivery · Georgetown gui2de
Research data systems for a one-year household diaries study.
Three hundred households. High-frequency checks. Automated quality workflows. Live apps on the study database so supervisors could act while data was still streaming from the field — not only after the wave closed.
Role
Lead research data systems for Georgetown University gui2de Health Financial Diaries work in East Africa: architecture, high-frequency checks, automation, and field-facing performance products.
This page describes systems and operational products that can be shown publicly. Raw diary records, household identifiers, and partner-restricted extracts stay private.
Problem
Year-long high-frequency household finance data fails in predictable ways if quality only happens at the end of a wave:
- Completeness and cleanliness drift by research assistant (RA) and by week
- Issues compound while teams wait for a batch clean
- Supervisors cannot see throughput, completion, or clean rates while the field is still active
The design goal was a streaming ops loop: field capture → study database → automated checks → live apps for supervisors.
What we built
1. Study scale and follow-up
- 300 households followed for one year
- High-frequency diary capture of health-related financial flows and related events
- Digital field workflows feeding a central study database
2. High-frequency checks (HFCs)
HFCs were not a report written after the fact. They were part of the daily operating rhythm: validation, completeness, and cleanliness signals that could surface problems early enough for field leadership to respond.
3. Automated systems
Automated workflows reduced ad hoc spreadsheet firefighting: standardized extracts, quality rules, and reporting layers that could update as new field data arrived.
4. Live ops apps
Two products sat on top of the live database while data streamed from the field:
| Product | What it did | Public access |
|---|---|---|
| RA leaderboard / performance | Field / RA monitoring — volume, completion, clean rates, rankings for supervisors | ra-leaderboard.streamlit.app |
| Fuel / issues app | Connected to the study database; aggregated field issues in real time as data streamed in | No public URL (internal ops tool) |
Fuel is intentionally not exposed publicly. It still belongs in this case study because it proves the streaming architecture: supervisors could see aggregated issues while field data was arriving, not only after wave closeout.
Field team performance dashboard
Sample month snapshot from the RA performance product. Staff names are redacted for public display (shown as RA–1, RA–2, RA–3). Aggregate KPIs remain visible.
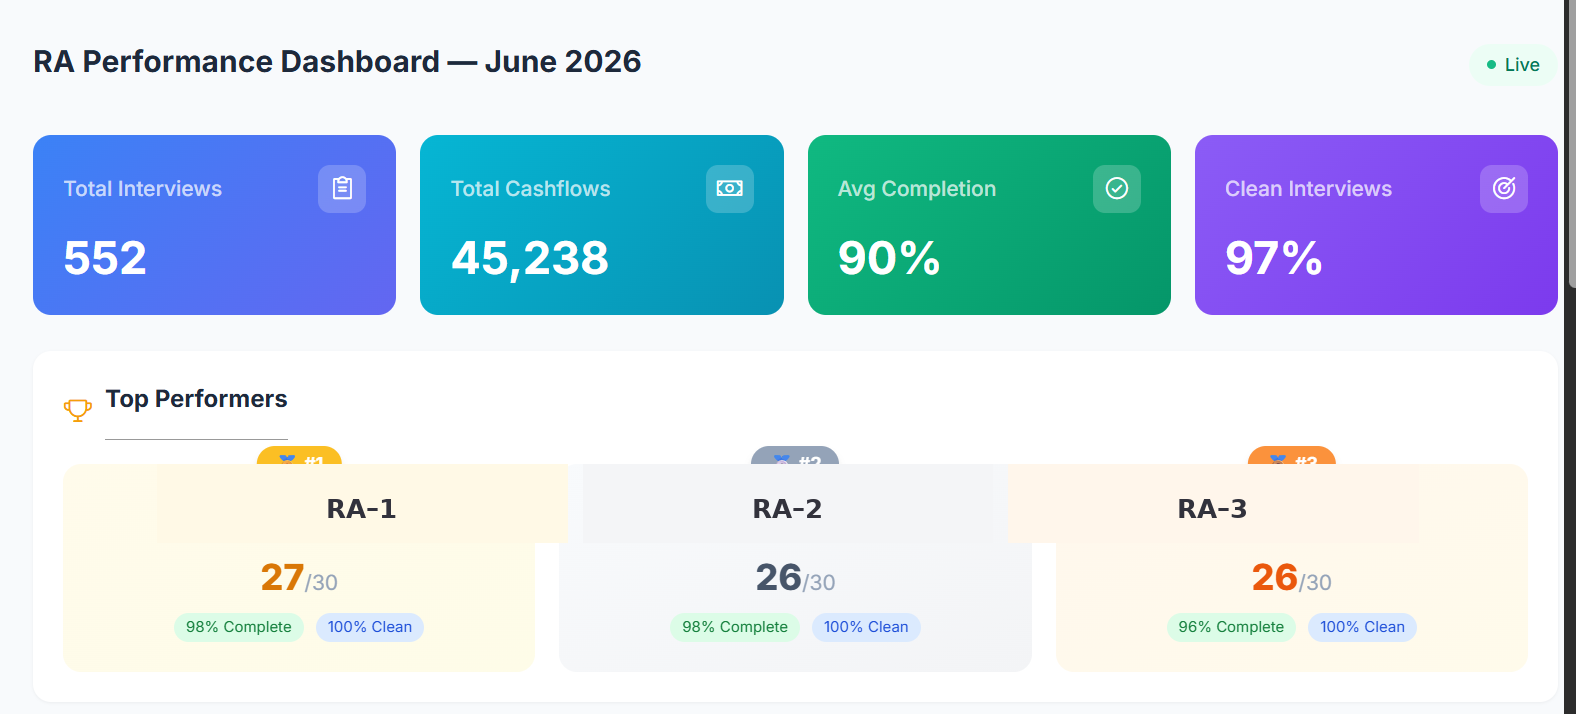
These metrics matter because they are operational, not decorative: they tell supervisors who is completing work cleanly and where the quality system needs attention.
Architecture (public-safe view)
Field RAs / instruments
        ↓
  Study database
        ↓
  HFCs + automated quality rules
        ↓
   ┌────────────────────┬────────────────────┐
   │  RA leaderboard    │  Fuel / issues app │
   │  (performance)     │  (live issue feed) │
   └────────────────────┴────────────────────┘
        ↓
  Analysis & policy products (partner channels)
What this demonstrates
For research and programme hiring, this work shows:
- Ownership of end-to-end research data systems, not only analysis at the end
- Quality architecture under real field constraints
- Product thinking for field supervisors, not only for PIs or donors
- Streaming design: act while data is arriving