I spent a long stretch of my Georgetown gui2de work on health financial diaries: not only the research idea of high-frequency household finance data, but the systems that keep that data trustworthy while the field is still running.
This is the first-person version of that work.
What we were actually collecting
Standard household surveys often ask people to recall health spending over a month or a year. Memory fails. Small frequent costs disappear. Informal payments and borrowing get under-reported.
Diaries try to fix that by tracking health-related financial flows more often — clinic fees, drugs, transport, lost income, gifts, loans, asset sales — so you can see volatility and coping, not only a smoothed total.
On this study we followed 300 households for one year. That is enough time for quality to drift, for research assistants (RAs) to differ, and for problems to compound if you only clean at the end of the wave.
The real problem was not the questionnaire alone
The hard part was operational:
- Data arrives continuously from the field
- Completeness and cleanliness differ by RA and by week
- Supervisors need signals during collection, not only after closeout
- Issues that sit in a spreadsheet for two weeks become expensive to fix
So we treated diaries as a streaming research data system: field capture → study database → high-frequency checks → live ops products → analysis and partner products.
What I built and ran
High-frequency checks (HFCs)
HFCs were part of the daily loop. The goal was simple: catch incomplete interviews, inconsistent cashflow patterns, and cleanliness problems early enough that field leadership could act while households were still in follow-up.
Automated systems
We automated as much of the quality and reporting path as we could — so every cycle did not start with a new round of ad hoc spreadsheet firefighting. The study database was the spine; scripts and apps sat on top of it.
Live ops apps
Two products mattered for day-to-day field control:
RA performance / leaderboard — volume, completion, and clean rates so supervisors could see who was keeping up and where quality was slipping.
Live: ra-leaderboard.streamlit.appFuel / issues app — connected to the same study database, aggregating field issues in real time as data streamed in. There is no public URL for Fuel (internal ops tool). The point of naming it here is architectural: issues were not only discovered in an end-of-wave clean.
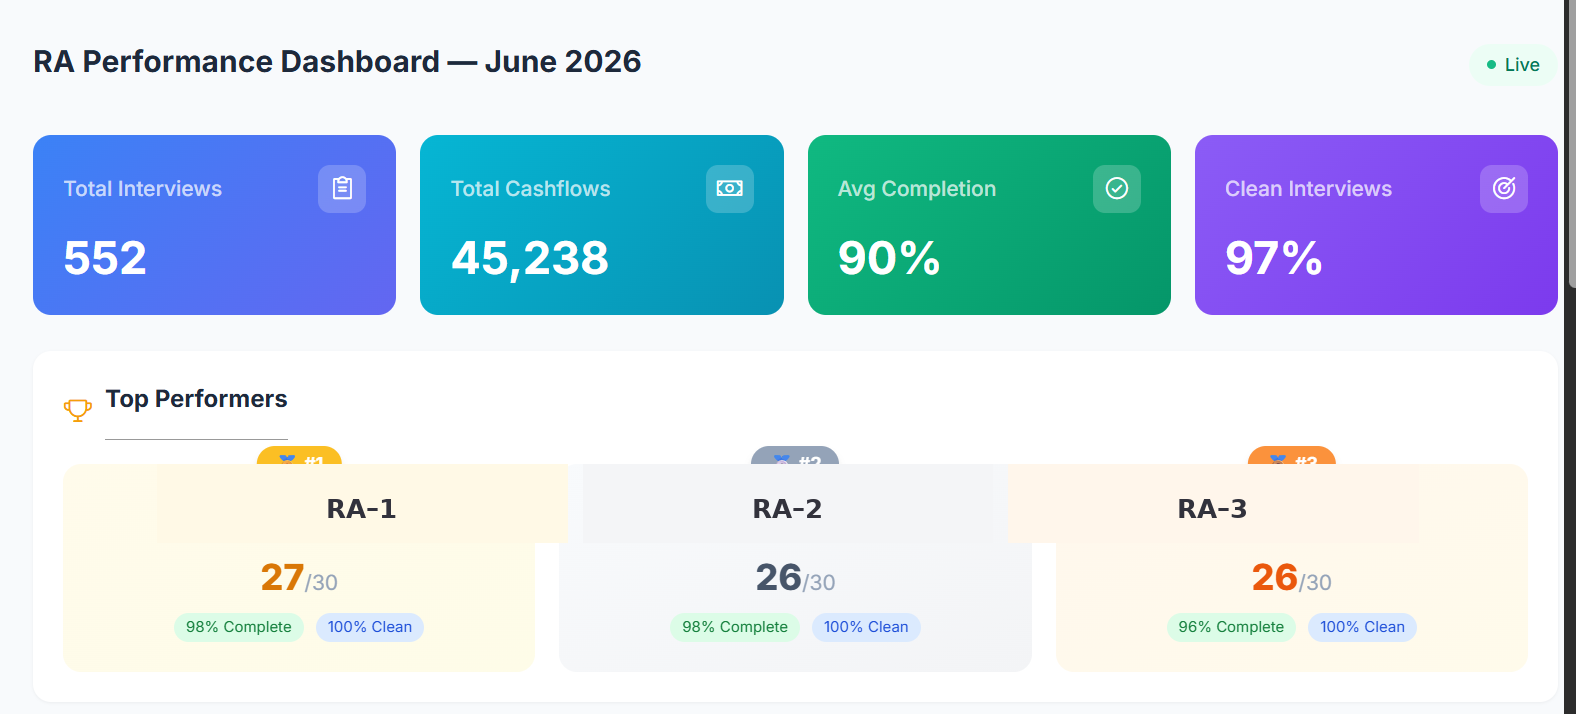
Those aggregate KPIs are the kind of number I care about in field systems: not vanity metrics, but signals a supervisor can use the same afternoon.
What diaries systems teach that a single dashboard does not
- Quality is a time-series problem. A 97% clean rate in one month means nothing if you cannot see who is driving the remaining 3% and whether it is getting worse.
- Ops products are research infrastructure. Leaderboards and issue feeds are not side projects; they are how you protect the analysis you hope to publish later.
- Streaming beats batch-only QC. When data is still arriving, the cheapest error is the one you catch today.
- Role clarity matters. My job was systems and quality architecture for programme research — not only writing a methods paragraph after the fact.
What stays private
Raw diary records, household identifiers, and partner-restricted extracts do not belong on a public portfolio. Staff names on performance boards are redacted in public screenshots. The public story is the architecture and the operational metrics, not the microdata.
If you are building something similar
Start with the database contract and the HFC rhythm before you polish a donor dashboard. If supervisors cannot see completion, cleanliness, and open issues while the field is live, you do not have a diaries system yet — you have a delayed cleaning project.