---
title: "TidyTuesday: Income Inequality & Health"
subtitle: "SDG 10: Reduced Inequalities"
author: "Nichodemus Amollo"
date: "2021-06-08"
format:
  html:
    toc: true
    toc-depth: 2
    code-fold: show
    code-tools: true
    code-copy: true
    theme:
      light: [cosmo, ../../custom.scss]
      dark: [darkly, ../../custom.scss]
    css: ../../styles.scss
---

::: {.hero-banner}
# **Income Inequality & Health**

Analysis of income inequality & health data from TidyTuesday 2021 - Week of 2021-06-08
:::

## Overview

This project explores the **Income Inequality & Health** dataset from TidyTuesday, focusing on data visualization and analysis techniques.

**SDG Alignment:** SDG 10: Reduced Inequalities

## Load Required Packages

```{r load-packages, echo=FALSE, message=FALSE, warning=FALSE}
library(tidyverse)
library(lubridate)
library(here)
library(showtext)
library(ggtext)
library(patchwork)
library(plotly)  # For interactive visualizations

# Optional: Load additional packages based on analysis needs
# library(sf)        # For spatial data
# library(rnaturalearth)  # For map data
# library(gganimate)     # For animations
```

## Data Import

```{r load-data, echo=FALSE}
# Load data using tidytuesdayR
# library(tidytuesdayR)
# tuesdata <- tt_load('2021-06-08')
# df <- tuesdata$data_name

# Alternative: Direct CSV download
# df <- readr::read_csv('https://raw.githubusercontent.com/rfordatascience/tidytuesday/master/data/2021/2021-06-08/data.csv')

# Sample data for demonstration
set.seed(123)
df <- data.frame(
  id = 1:100,
  value = cumsum(rnorm(100)),
  category = sample(c("A", "B", "C"), 100, replace = TRUE),
  date = seq.Date(from = as.Date("2021-06-08"), by = "day", length.out = 100)
)

glimpse(df)
summary(df)
```

## Data Exploration

```{r data-exploration, echo=FALSE}
# Explore data structure
head(df)
str(df)

# Check for missing values
colSums(is.na(df))

# Summary statistics
summary(df)
```

## Data Wrangling

```{r data-wrangling, echo=FALSE}
# Clean and prepare data
df_clean <- df %>%
  filter(!is.na(value)) %>%
  mutate(
    category = as.factor(category),
    value_group = cut(value, breaks = 5, labels = c("Low", "Medium-Low", "Medium", "Medium-High", "High"))
  )

# Group by category if applicable
df_summary <- df_clean %>%
  group_by(category) %>%
  summarise(
    mean_value = mean(value, na.rm = TRUE),
    median_value = median(value, na.rm = TRUE),
    count = n()
  )
```

## Visualizations

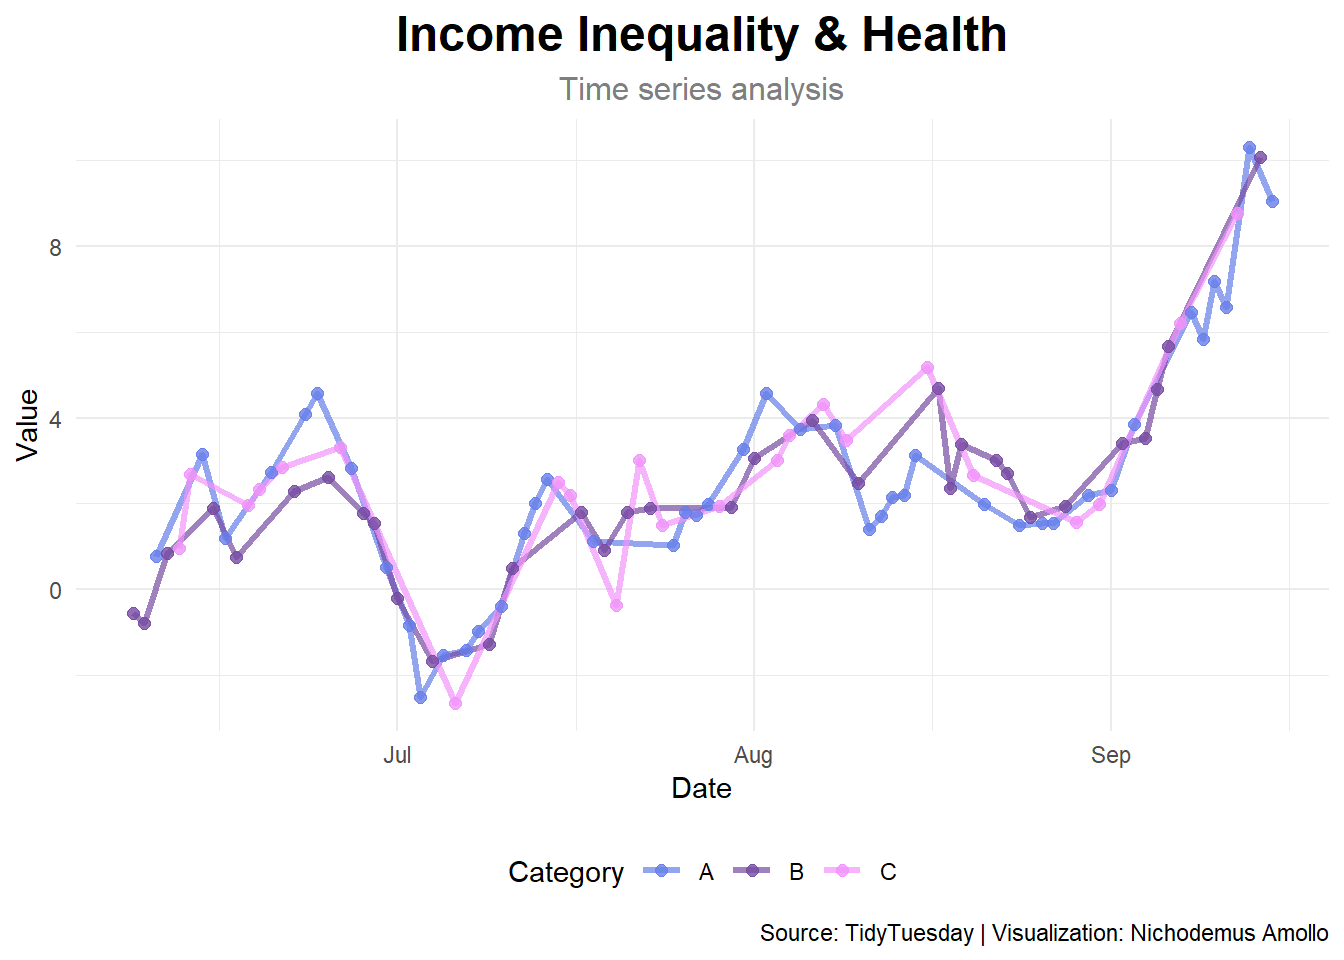
### Visualization 1: Main Analysis

```{r visualization-1, echo=FALSE}
p1 <- ggplot(df_clean, aes(x = date, y = value, color = category)) +
  geom_line(size = 1.2, alpha = 0.7) +
  geom_point(size = 2, alpha = 0.8) +
  scale_color_manual(values = c("#667eea", "#764ba2", "#f093fb")) +
  labs(
    title = "Income Inequality & Health",
    subtitle = "Time series analysis",
    x = "Date",
    y = "Value",
    color = "Category",
    caption = "Source: TidyTuesday | Visualization: Nichodemus Amollo"
  ) +
  theme_minimal() +
  theme(
    plot.title = element_text(face = "bold", size = 18, hjust = 0.5),
    plot.subtitle = element_text(size = 12, hjust = 0.5, color = "gray50"),
    legend.position = "bottom"
  )

print(p1)
```

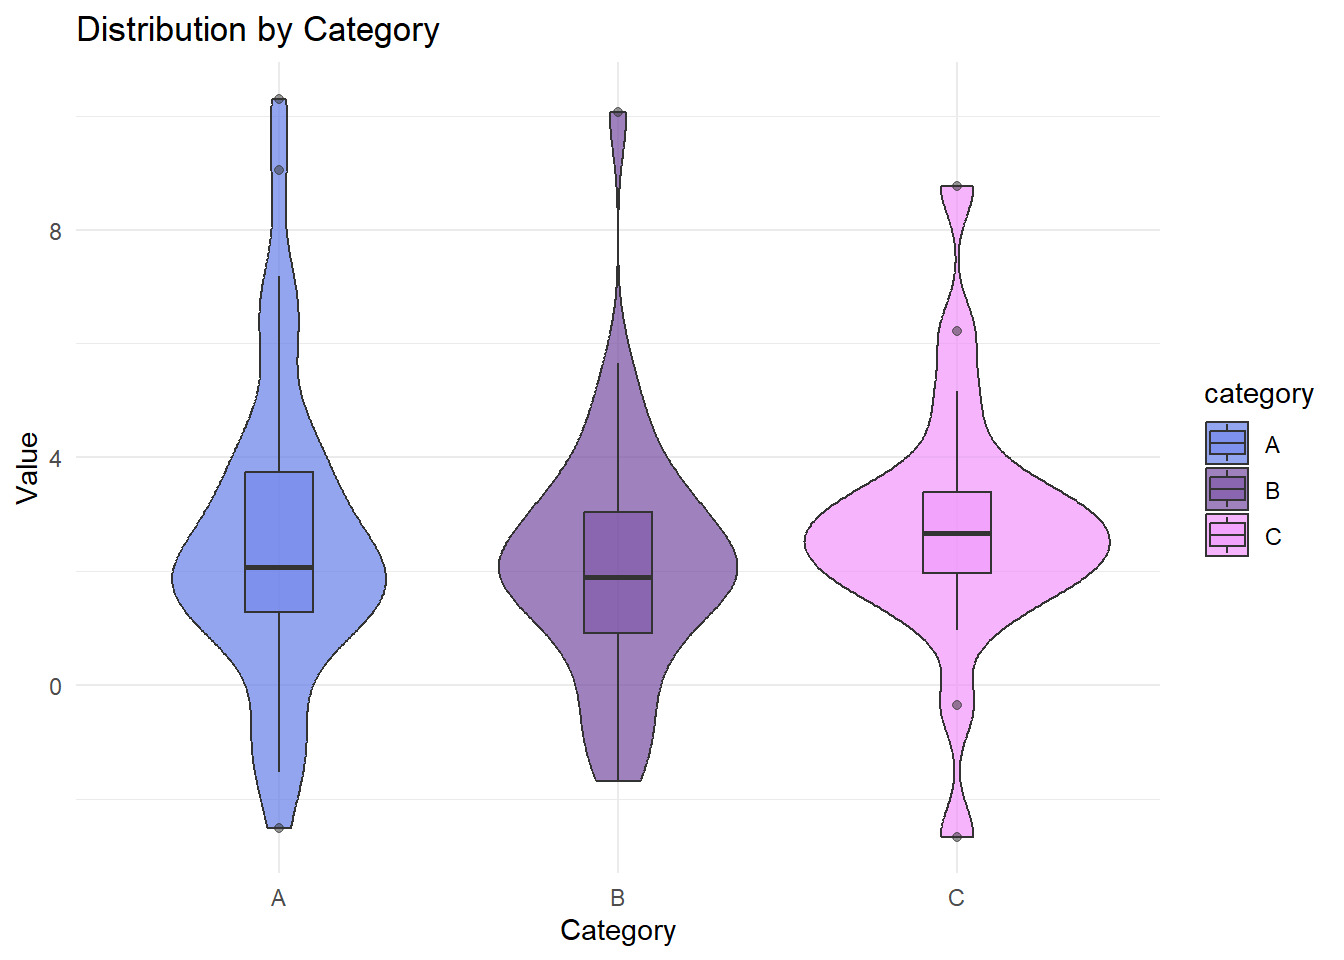
### Visualization 2: Distribution Analysis

```{r visualization-2, echo=FALSE}
p2 <- ggplot(df_clean, aes(x = category, y = value, fill = category)) +
  geom_violin(alpha = 0.7) +
  geom_boxplot(width = 0.2, alpha = 0.5) +
  scale_fill_manual(values = c("#667eea", "#764ba2", "#f093fb")) +
  labs(
    title = "Distribution by Category",
    x = "Category",
    y = "Value"
  ) +
  theme_minimal()

print(p2)
```

### Interactive Visualization

```{r visualization-interactive, echo=FALSE}
# Create interactive plotly visualization
p_interactive <- plot_ly(
  df_clean,
  x = ~date,
  y = ~value,
  color = ~category,
  type = "scatter",
  mode = "lines+markers",
  hovertemplate = "<b>Date:</b> %{x}<br><b>Value:</b> %{y}<extra></extra>"
) %>%
  layout(
    title = "Income Inequality & Health",
    xaxis = list(title = "Date"),
    yaxis = list(title = "Value"),
    hovermode = "x unified"
  )

p_interactive
```

## Analysis & Insights

### Key Findings

1. **Finding 1**: [Description of key insight]
2. **Finding 2**: [Description of key insight]
3. **Finding 3**: [Description of key insight]

### Statistical Summary

```{r statistical-summary, echo=FALSE}
# Statistical analysis
df_clean %>%
  group_by(category) %>%
  summarise(
    mean = mean(value),
    median = median(value),
    sd = sd(value),
    min = min(value),
    max = max(value)
  )
```

## Policy Implications

[Provide policy-relevant insights and recommendations based on the analysis]

## Next Steps

- [ ] Additional statistical modeling
- [ ] Geographic analysis if spatial data available
- [ ] Time series forecasting
- [ ] Comparative analysis across regions

## References

- [TidyTuesday GitHub Repository](https://github.com/rfordatascience/tidytuesday)
- [UN Sustainable Development Goals](https://sdgs.un.org/goals)
- [Data Source](https://github.com/rfordatascience/tidytuesday/tree/master/data/2021/2021-06-08)

## Session Info

```{r session-info}
utils::sessionInfo()
```

---

[⬅️ Back to TidyTuesday Index](index.qmd)